A Vegan Diet Cut Dietary Energy Density by 30 Per Cent
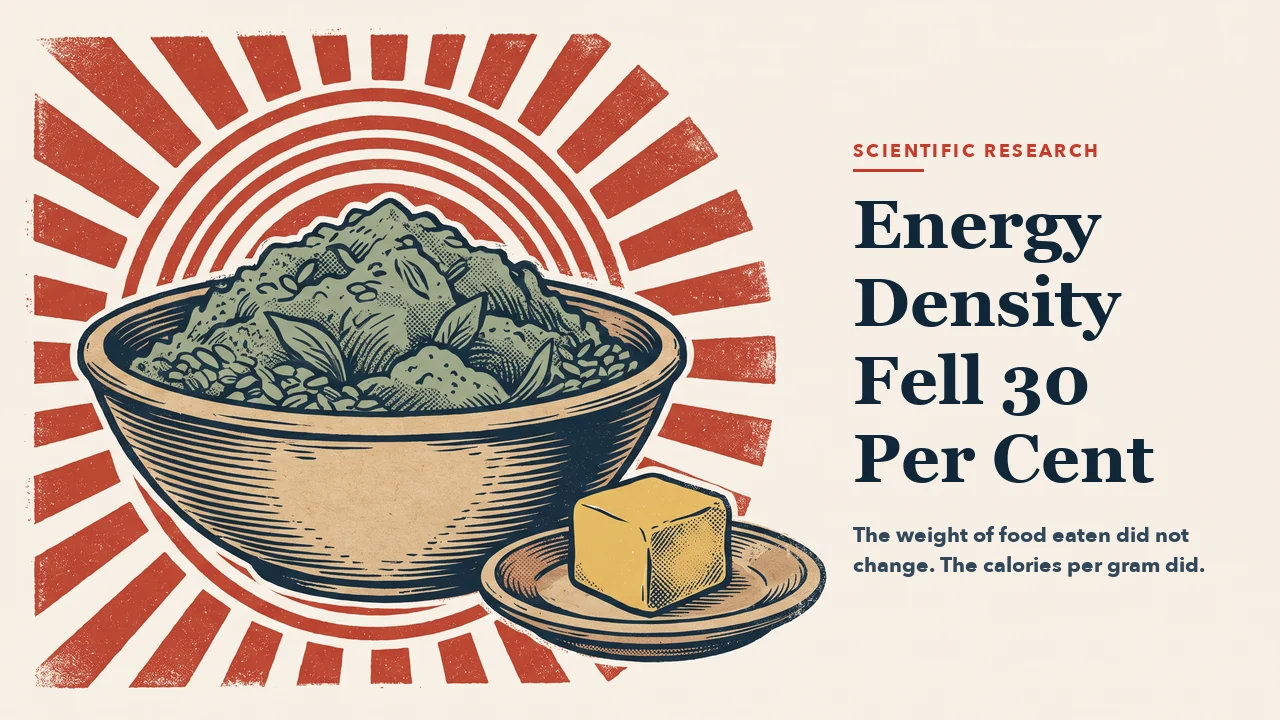
People tend to eat a fairly constant weight of food each day. While that holds, the calories in each gram of that food — its energy density — decide how much energy ends up on the plate. A secondary analysis of a randomised trial, published in JAMA Network Open on 6 August 2026, measured exactly that. When participants moved to a vegan diet, energy density fell by about 30 per cent — and the weight of food they ate did not change.
The trial behind the analysis
The data come from a 16-week randomised trial run in Washington, DC between January 2017 and February 2019 (ClinicalTrials.gov NCT02939638). Of 3,115 people screened by telephone, 244 adults with overweight were randomly assigned in a 1:1 ratio: 122 were asked to follow a low-fat vegan diet of fruits, vegetables, grains and legumes, and 122 were asked to change nothing. Neither group was given a calorie limit. Participants kept a three-day food diary at week 0 and week 16, analysed by a registered dietitian. In the original trial the vegan group lost 5.9 kg (95% CI, 5.0–6.7 kg) over the 16 weeks, while the control group did not change significantly.
This new paper is an ad hoc secondary analysis of those food diaries. For each participant and each food group, the researchers divided total daily energy (kcal) by total daily food weight (g). That ratio is dietary energy density. The analysis included the 223 participants who completed the trial — 91.0 per cent, as the paper reports it — and was carried out between April and June 2026.
What they found
Three numbers carry the paper.
The weight of food did not change. In the vegan group it went from 1,825.2 g/day to 1,930.5 g/day, a change of 105.3 g/day (95% CI, −37.2 to 247.8) — not statistically significant, and no different from the control group (P = 0.31). People kept filling their plates.
The calories fell. Daily energy intake in the vegan group dropped from 1,834.3 kcal to 1,343.4 kcal, a fall of 490.9 kcal/day (95% CI, −608.1 to −373.7). The control group also ate less — 133.8 kcal/day less — so the difference attributable to the diet was 357.1 kcal/day (95% CI, −521.9 to −192.3; P < 0.001). Nobody in the vegan group had been told to cut calories.
Energy density fell by about 30 per cent. It went from 1.1 kcal/g to 0.7 kcal/g in the vegan group and did not change in the control group. The difference between groups was −0.28 kcal/g per day (95% CI, −0.38 to −0.19; P < 0.001).
The three findings fit together: the same volume of food, made of less concentrated ingredients, carries fewer calories.
Which foods moved
The food-group table is the most practical part of the paper. In the vegan group, per day:
- Vegetables rose by 143.3 g and fruits by 79.5 g.
- Legumes rose by 74.4 g, from 35.8 g to 110.2 g — about three times the starting amount.
- Non-dairy alternatives rose by 88.4 g.
- Meat, poultry, fish and shellfish fell by 100.5 g, dairy by 127.0 g, eggs by 30.0 g — as the diet requires.
- Nuts and fats fell by 26.5 g. In energy terms this was the single biggest drop among plant foods: from 228.7 kcal/day to 83.7 kcal/day. This was a low-fat vegan diet, not simply a vegan one.
- Sweets and desserts fell by 34.2 g and by 115.9 kcal/day.
- Grains did not change significantly in the vegan group (+31.0 g/day), but fell by 75.5 g/day in the control group.
One detail is easy to misread. The energy density within some plant groups went up, not down: legumes rose from 0.7 to 1.1 kcal/g and nuts and fats from 6.5 to 7.2 kcal/g. The authors state plainly what this means: these shifts reflect changes in which foods were chosen inside each group, not any change in the foods themselves. A participant who moves from a watery soup to a plate of cooked beans raises the energy density of their “legumes” without anything having happened to beans.
What energy density looks like on a plate
“1.1 down to 0.7 kcal/g” means little until you see where real foods sit. The trial measured that too: this is the energy density of what these participants actually ate in each food group at the start, before anyone changed anything.
| Food group (as eaten, week 0) | Energy density, kcal/g |
|---|---|
| Beverages | 0.2 |
| Vegetables | 0.5 |
| Fruits | 0.5 |
| Legumes | 0.7 |
| Non-dairy alternatives | 0.9 |
| Meat, poultry, fish and shellfish | 1.7 |
| Grains | 1.9 |
| Dairy | 1.9 |
| Mixed foods and sauces | 1.9 |
| Sweets and desserts | 2.5 |
| Nuts and fats | 6.5 |
| Whole diet | 1.1 |
Read down that column and the arithmetic of a plate becomes visible. Two components decide almost everything: water carries 0 kcal per gram and fat carries 9, so the more water-rich the ingredient, the lower the number. That is why vegetables and fruit sit near 0.5 while nuts and oils sit above 6 — and why a tablespoon of oil moves a meal’s average further than a whole extra plate of salad does.
It also explains the scale of the shift. Moving a whole day’s eating from 1.1 to 0.7 kcal/g, while still eating about 1,900 g of food, is the difference between roughly 2,090 and 1,330 kcal at the same volume. The authors make the point that a change of this size is unlikely to be achieved and sustained through portion control alone.
Two practical findings come from this line of research, outside the trial. Eating a large portion of a low-energy-dense first course — soup, salad or fruit — reduces how much is eaten at the rest of the meal. And when the energy density of a diet is lowered, both adults and children reduce their intake spontaneously, without being asked.
The link with weight, and how strong it is
A greater fall in energy density went with greater weight loss: r = 0.28 (95% CI, 0.15–0.39; P < 0.001). Adjusting for the change in energy intake weakened it but did not remove it: r = 0.21 (95% CI, 0.08–0.34; P = 0.002). Losing 1 kg corresponded to a 0.29-unit fall in energy density, or 0.36 units after adjustment.
That correlation deserves an honest reading. A coefficient of 0.28 means energy density accounts for under a tenth of the variation in how much weight individual participants lost. It is a real and statistically robust signal about a mechanism; it is not a formula that predicts what any one person will lose.
What this study cannot tell you
The design has genuine strengths — randomised, parallel groups, a statistician blinded to the assignments, and a control group that accounts for seasonal effects. The limits matter just as much:
- It is a secondary, ad hoc analysis. The trial was not designed to answer this question; the hypothesis came after the data.
- Food intake was self-reported in three-day diaries. People under-report, and they do not all under-report equally.
- Participants were volunteers who answered advertisements, mostly women (87 per cent in the original trial) with a mean age of 54.4 years. This is not the general population.
- A correlation does not prove a mechanism. Lower energy density is a plausible route to lower intake, and controlled feeding studies support it, but this analysis cannot rule out that both changes follow from something else about the diet.
- Nobody was blinded to the diet. In an open trial of an eating pattern, that is unavoidable — and it is a reason to be careful with self-reported intake.
Lower is not a goal for everyone
Low energy density is a tool for someone who is eating more energy than they need. Turn the same mechanism around and it becomes a risk.
The clearest demonstration is an older study in the opposite direction. In 36 hospitalised patients aged 52 to 96, researchers raised the energy density of ordinary hospital food, from 1,670 to 2,520 kcal a day, while keeping the volume of the servings the same. The patients ate the same share of their plates as before — about 80 per cent — but their energy intake rose by 40 per cent and their body weight by 3.4 per cent in three weeks. The authors’ conclusion was that it is the volume of food, not its energy, that limits how much these patients can eat.
That is the same mechanism this new paper describes, read from the other end, and it is why the advice is not universal:
- Older people who are frail, ill or losing weight. The ESPEN guideline on nutrition in geriatrics states that dietary restrictions should generally be avoided in older persons, and that weight-reducing diets should only be considered in those who are obese and have weight-related health problems, combined with physical exercise. Filling a small appetite with bulky, watery food can make an intake problem worse.
- Anyone with a reduced appetite — during illness or recovery, or with a condition that limits how much can be eaten at a sitting.
- Children. In 2,442 US children aged 2 to 8, a higher dietary energy density did go with higher body weight; obese children averaged 2.08 kcal/g against 1.93 in lean children. But the route the authors describe is more fruit and vegetables and less fat, not restriction — and a child’s diet should never be managed on volume alone without their doctor.
The honest summary is that energy density is a lever, not a virtue. Which way you want to move it depends on what your body currently needs.
Who funded it
The study was funded by the Physicians Committee for Responsible Medicine (PCRM), and four of the five authors work there. The senior author, Neal D. Barnard, is president of PCRM and reports royalties and honoraria from books and lectures on nutrition. Richard Holubkov, the statistician, is at the University of Utah and reported personal and consulting fees from PCRM. The journal states that the funder had no role in the design, analysis or decision to publish.
PCRM advocates plant-based diets. That does not make the numbers wrong: the trial is registered, randomised and published in a peer-reviewed journal with its data-sharing statement. But it is the kind of context a reader is entitled to have, and a reason to give more weight to the raw measurements than to the framing around them. Our own guide to reading nutrition research explains why funding and design belong in the same glance as the result.
What to take away
The practical claim in this paper is narrower than “a vegan diet makes you lose weight”, and more useful. It says that a plate built around vegetables, fruits, whole grains and legumes carries fewer calories at the same weight, and that people eating that way ate about 350 fewer calories a day than the control group without being asked to. Water and fibre take up room; fat does not.
It also quietly says something about fat. The largest calorie drop among plant foods came from nuts and oils. If you keep the volume of plant food high but add generous oil, you undo much of the shift this paper is describing.
If you want the practical version of this, our guide to building a balanced vegan plate and the piece on spreading legumes across meals cover how to get the volume without the calorie load. And a reminder that applies to every study of this kind: a mechanism found in 223 volunteers over 16 weeks is a good reason to understand your plate better, not a reason to change medication or to treat any diet as a treatment.
Sources
- Kahleova H, Znayenko-Miller T, Maracine C, Holubkov R, Barnard ND. Vegan Diets and Dietary Energy Density: A Secondary Analysis of a Randomized Clinical Trial. JAMA Netw Open. 2026;9(8):e2627483. doi:10.1001/jamanetworkopen.2026.27483.
- Kahleova H, Petersen KF, Shulman GI, et al. Effect of a Low-Fat Vegan Diet on Body Weight, Insulin Sensitivity, Postprandial Metabolism, and Intramyocellular and Hepatocellular Lipid Levels in Overweight Adults: A Randomized Clinical Trial. JAMA Netw Open. 2020;3(11):e2025454. doi:10.1001/jamanetworkopen.2020.25454.
- Rolls BJ. Dietary energy density: applying behavioural science to weight management. Nutr Bull. 2017;42(3):246-253. doi:10.1111/nbu.12280.
- Rolls BJ. The relationship between dietary energy density and energy intake. Physiol Behav. 2009;97(5):609-615. doi:10.1016/j.physbeh.2009.03.011.
- Rolls BJ, Roe LS, Beach AM, Kris-Etherton PM. Provision of foods differing in energy density affects long-term weight loss. Obes Res. 2005;13(6):1052-1060. doi:10.1038/oby.2005.123.
- Rolls BJ, Roe LS, Meengs JS. Salad and satiety: energy density and portion size of a first-course salad affect energy intake at lunch. J Am Diet Assoc. 2004;104(10):1570-1576. doi:10.1016/j.jada.2004.07.001.
- Olin AO, Österberg P, Hådell K, et al. Energy-enriched hospital food to improve energy intake in elderly patients. JPEN J Parenter Enteral Nutr. 1996;20(2):93-97. doi:10.1177/014860719602000293.
- Volkert D, Beck AM, Cederholm T, et al. ESPEN guideline on clinical nutrition and hydration in geriatrics. Clin Nutr. 2019;38(1):10-47. doi:10.1016/j.clnu.2018.05.024.
- Vernarelli JA, Mitchell DC, Hartman TJ, Rolls BJ. Dietary energy density is associated with body weight status and vegetable intake in U.S. children. J Nutr. 2011;141(12):2204-2210. doi:10.3945/jn.111.146092.
Editor: Anıl Güler, Pharmacist
Last scientific review: 26 September 2026